Results
The output is shown in different formats across 3 tabs:
-
Molecules: This section displays the table of results, including the input and output molecules, the group replaced, and the physicochemical properties as shown in Figure 2. This table can be filtered based on these properties and downloaded.
This section also shows a grid of 2D diagrams of the output molecules, which corresponds to the column “GEN-MOL-SMI” in the table. (Figure 3)
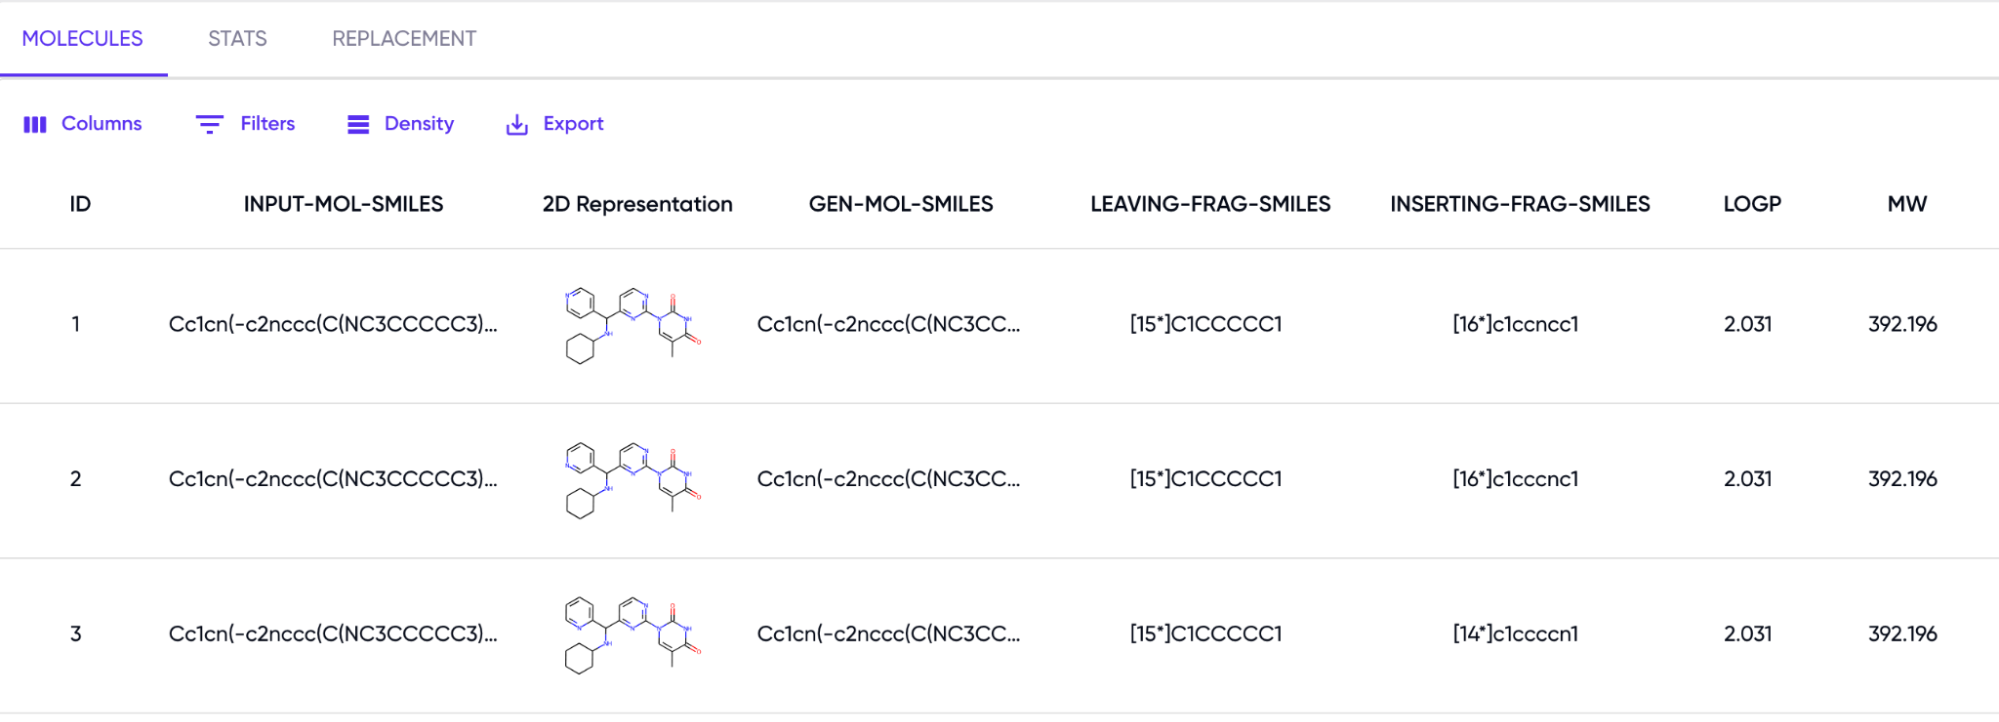
Figure 2: Table of Generated Molecules and Physicochemical Properties
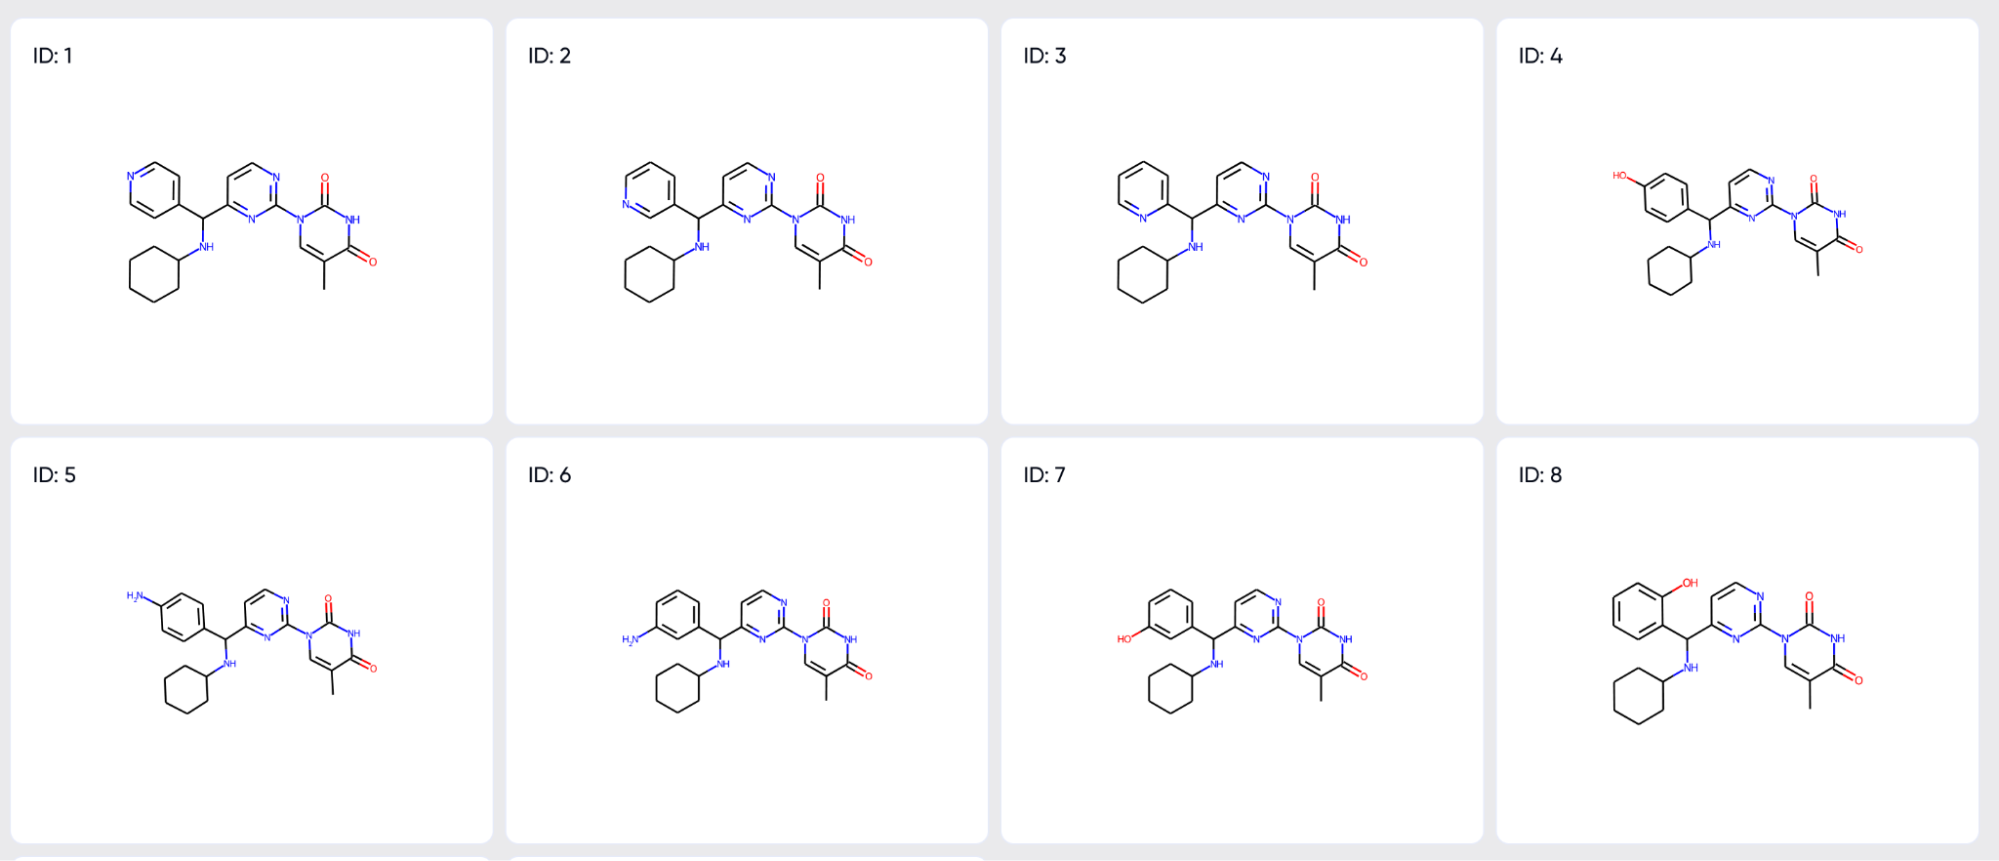
Figure 3: Grid of 2D representations of Generated Molecules
- Stats: This section includes the following plots:
- Properties of the reference molecule: the QED, SA, Mol. Wt. and logP of the input are displayed.
- Distribution of the properties of generated molecules (Figure 4). The red line corresponds to the reference.
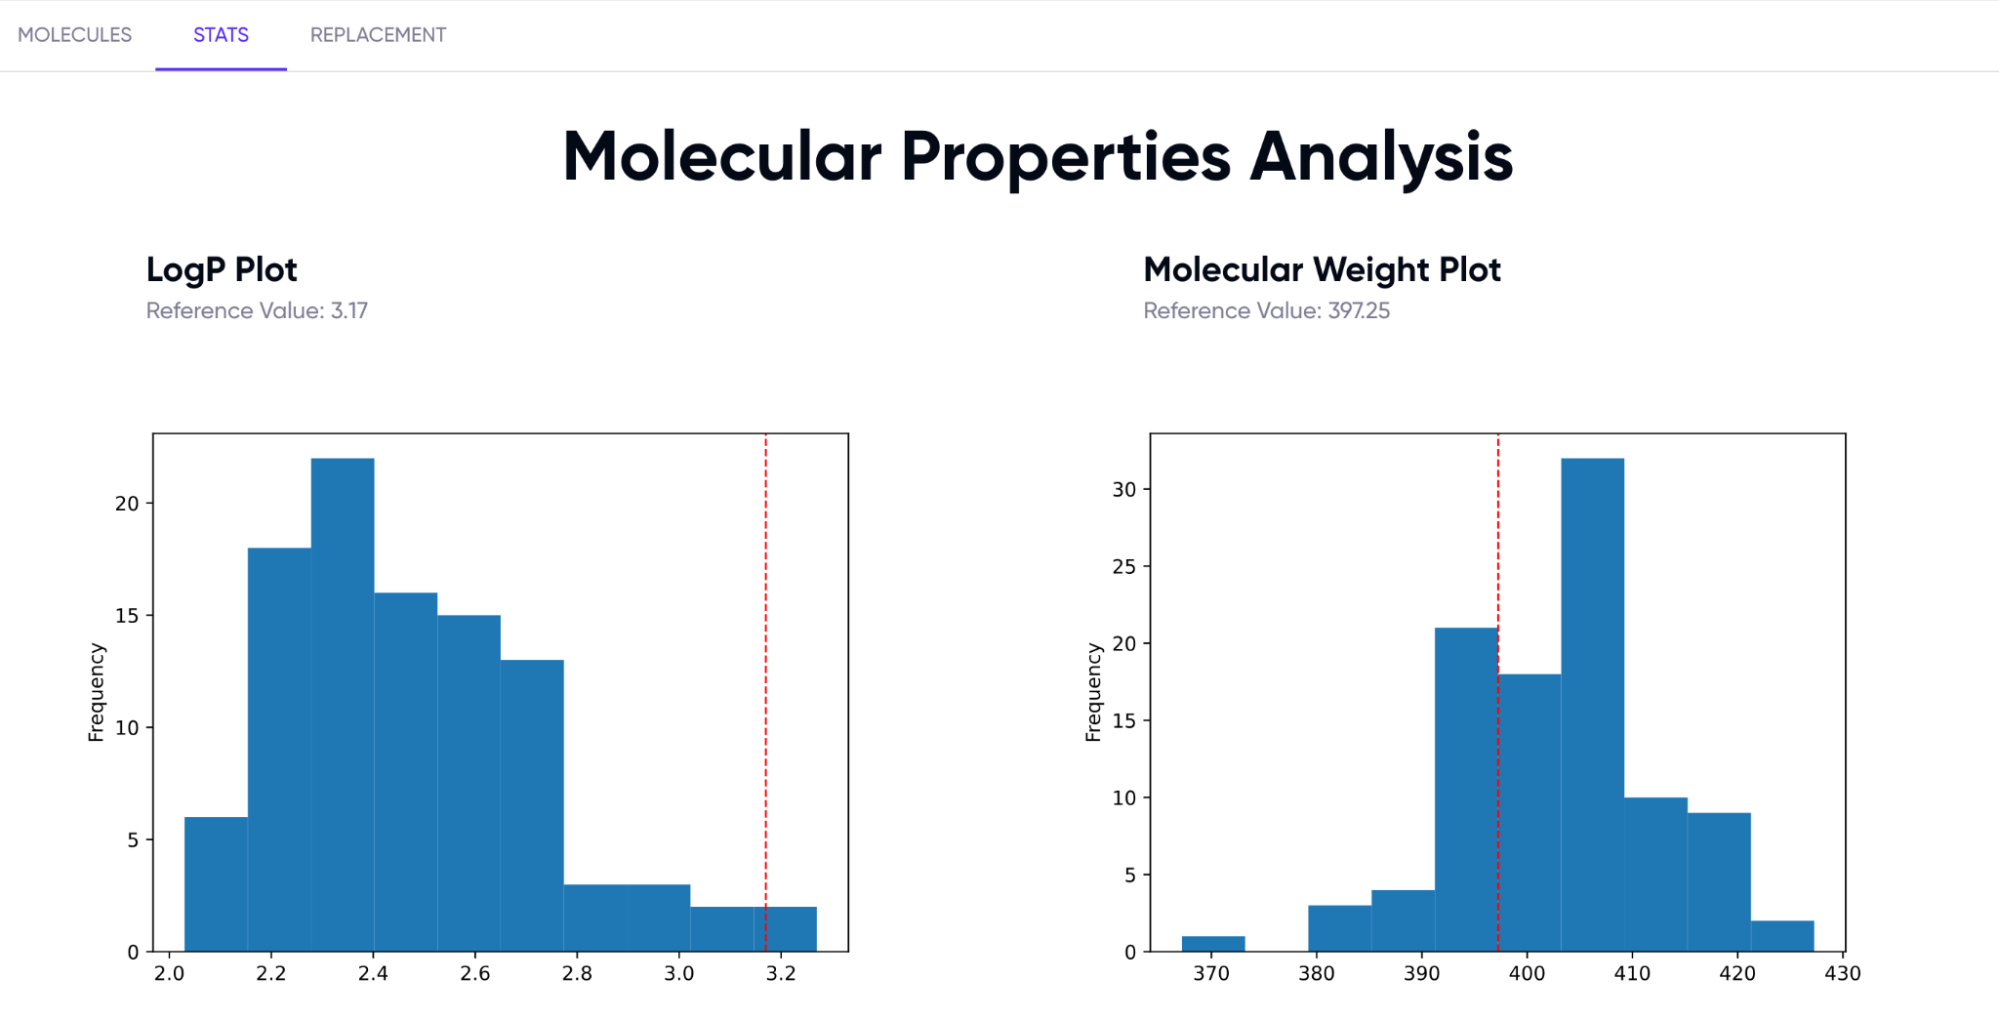
Figure 4: QED, logP, Mol.Wt and SA score plots for the generated molecules
- Replacement: This tab shows a list of the most frequently replaced fragments for each leaving group. Each row describes a single removed fragment, and the groups by which it was replaced by the model in descending order of frequency (Figure 5):
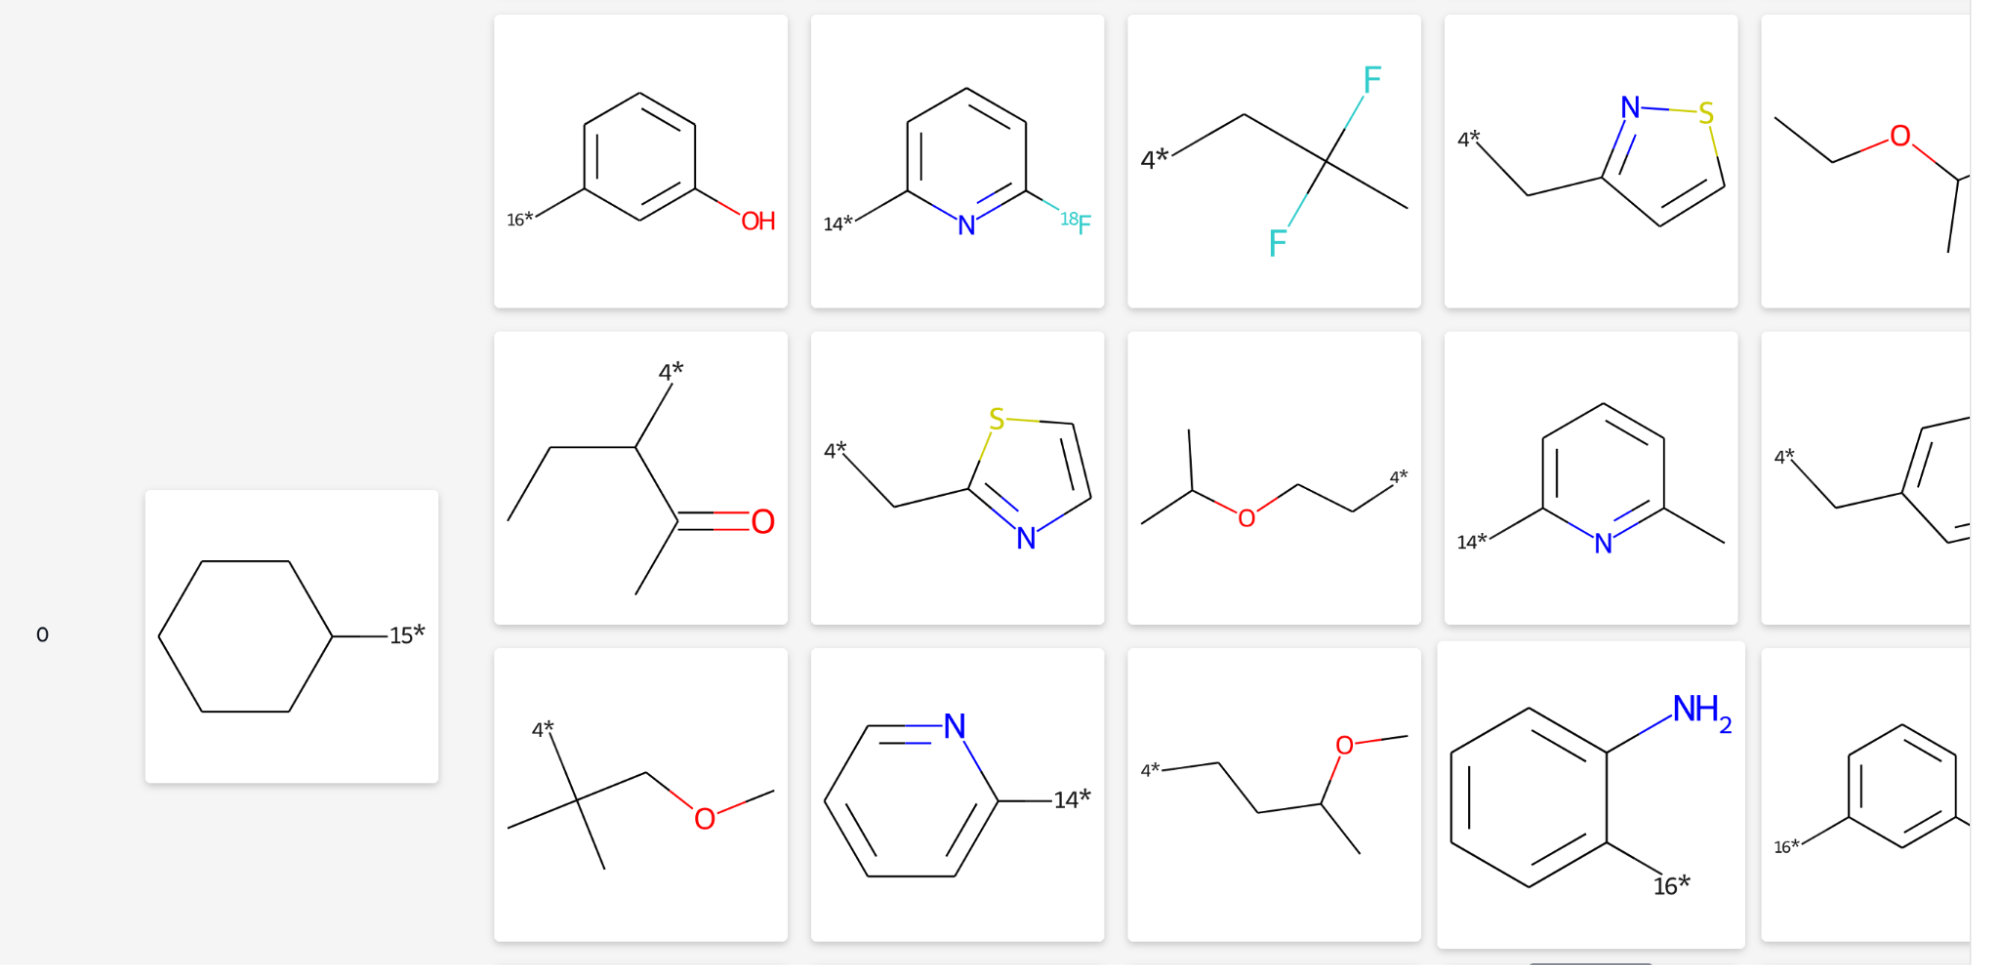
Figure 5: Table of removed and inserted fragments